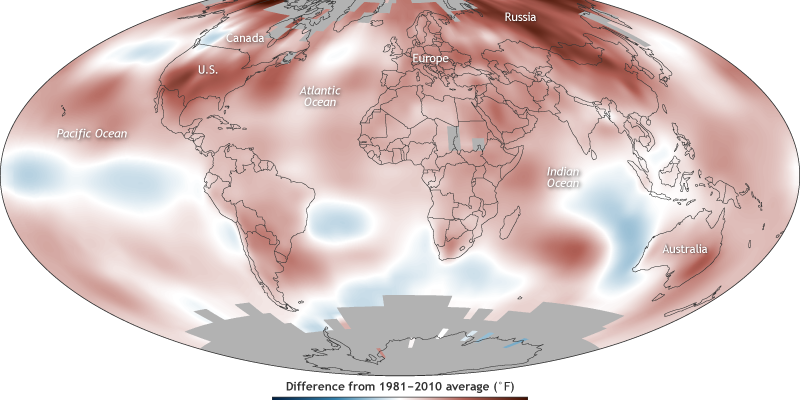
International report confirms 2017 was among the three warmest years on record
A new State of the Climate report confirmed that 2017 was one of the three warmest years in records dating to the mid-1800s.
Last year was one of the warmest years on record despite the lack of a short-term warming El Niño influence
Last year was one of the warmest years on record despite the lack of a short-term warming El Niño influence. The report found that the major indicators of climate change continued to reflect trends consistent with a warming planet. Several markers such as greenhouse gas concentrations in the atmosphere and sea level broke records set just one year prior.
These key findings and others are available from the State of the Climate in 2017 report released online today by the American Meteorological Society (AMS).
The 28th annual issuance of the report, led by NOAA National Centers for Environmental Information, is based on contributions from more than 500 scientists from over 60 countries around the world and reflects tens of thousands of measurements from multiple independent datasets. It provides a detailed update on global climate indicators, notable weather events and other data collected by environmental monitoring stations and instruments located on land, water, ice and in space.
The report’s climate indicators show patterns, changes and trends of the global climate system. Examples of the indicators include various types of greenhouse gases; temperatures throughout the atmosphere, ocean and land; cloud cover; sea level; ocean salinity; sea ice extent and snow cover.
Report highlights include these indications of a warming planet.
Greenhouse Gases Highest on Record
Major greenhouse gas concentrations, including carbon dioxide (CO2), methane and nitrous oxide, rose
to new record high values during 2017. The global annual average atmospheric CO2 concentration was 405.0 parts per million (ppm). This was 2.2 ppm greater than the 2016 amount and was the highest in the modern measurement record and in ice core records dating back as far as 800,000 years.
Global Surface Temperature Near-Record High
Global surface temperatures were 0.68°-0.86°F (0.38°-0.48°C) above the 1981-2010 average, depending on the dataset used. This places 2017 as the second or third warmest annual global temperature since records began in the mid- to late 1800s. It was also the warmest non-El Niño year on record, as El Niño–Southern Oscillation (ENSO) conditions were neutral through much of 2017, with weak La Niña conditions at the start and end. The four warmest years on record have all occurred since 2014.
Global Lower Tropospheric Temperature Near-Record High
In the region of the atmosphere just above Earth’s surface, the globally averaged lower troposphere temperature was also second or third highest on record, depending on the dataset used.
Sea Surface Temperatures Near-Record High
While the global average sea surface temperature (SST) in 2017 was slightly below the 2016 value, the long-term trend remained upward, with the last three years seeing the three highest annual average SSTs on record. Since 2000, global SST has been increasing at an average rate of 0.17°C per decade.
Global Upper Ocean Heat Content Record High
Globally, upper ocean heat content reached record highs in 2017, reflecting the continuing accumulation of thermal energy in the top 2,300 feet (700 meters) of the ocean. Oceans absorb more than 90 percent of Earth’s excess heat from global warming.
Global Sea Level Highest on Record
Global average sea level rose to a new record high in 2017 and was about 3.0 inches (7.7 cm) higher than the 1993 average, the year that marks the beginning of the satellite altimeter record. Levels have risen year-to-year for six consecutive years and in 22 of the last 24 years. Global sea level is rising at an average rate of 1.2 inches (3.1 cm) per decade.
Extremes Were Observed in Precipitation
After a significant peak in global drought area in 2016, the drought area fell sharply in early 2017 before rising to above-average values once again later in the year. At least 3 percent of land area was affected by extreme drought conditions in each month of 2017, and this is the fourth greatest monthly percentage of severe drought since 1950 (after 1984, 1985 and 2016). Severe drought conditions in British Columbia contributed to its most extensive wildfire season on record. On the high end of the precipitation spectrum, Severe Tropical Cyclone Debbie (March 27-April 6) in Australia and New Zealand and Hurricane Harvey (August 25-September 1) in the U.S. produced unprecedented impacts from heavy rainfall.
The report also documents key regional climate and climate-related events.


