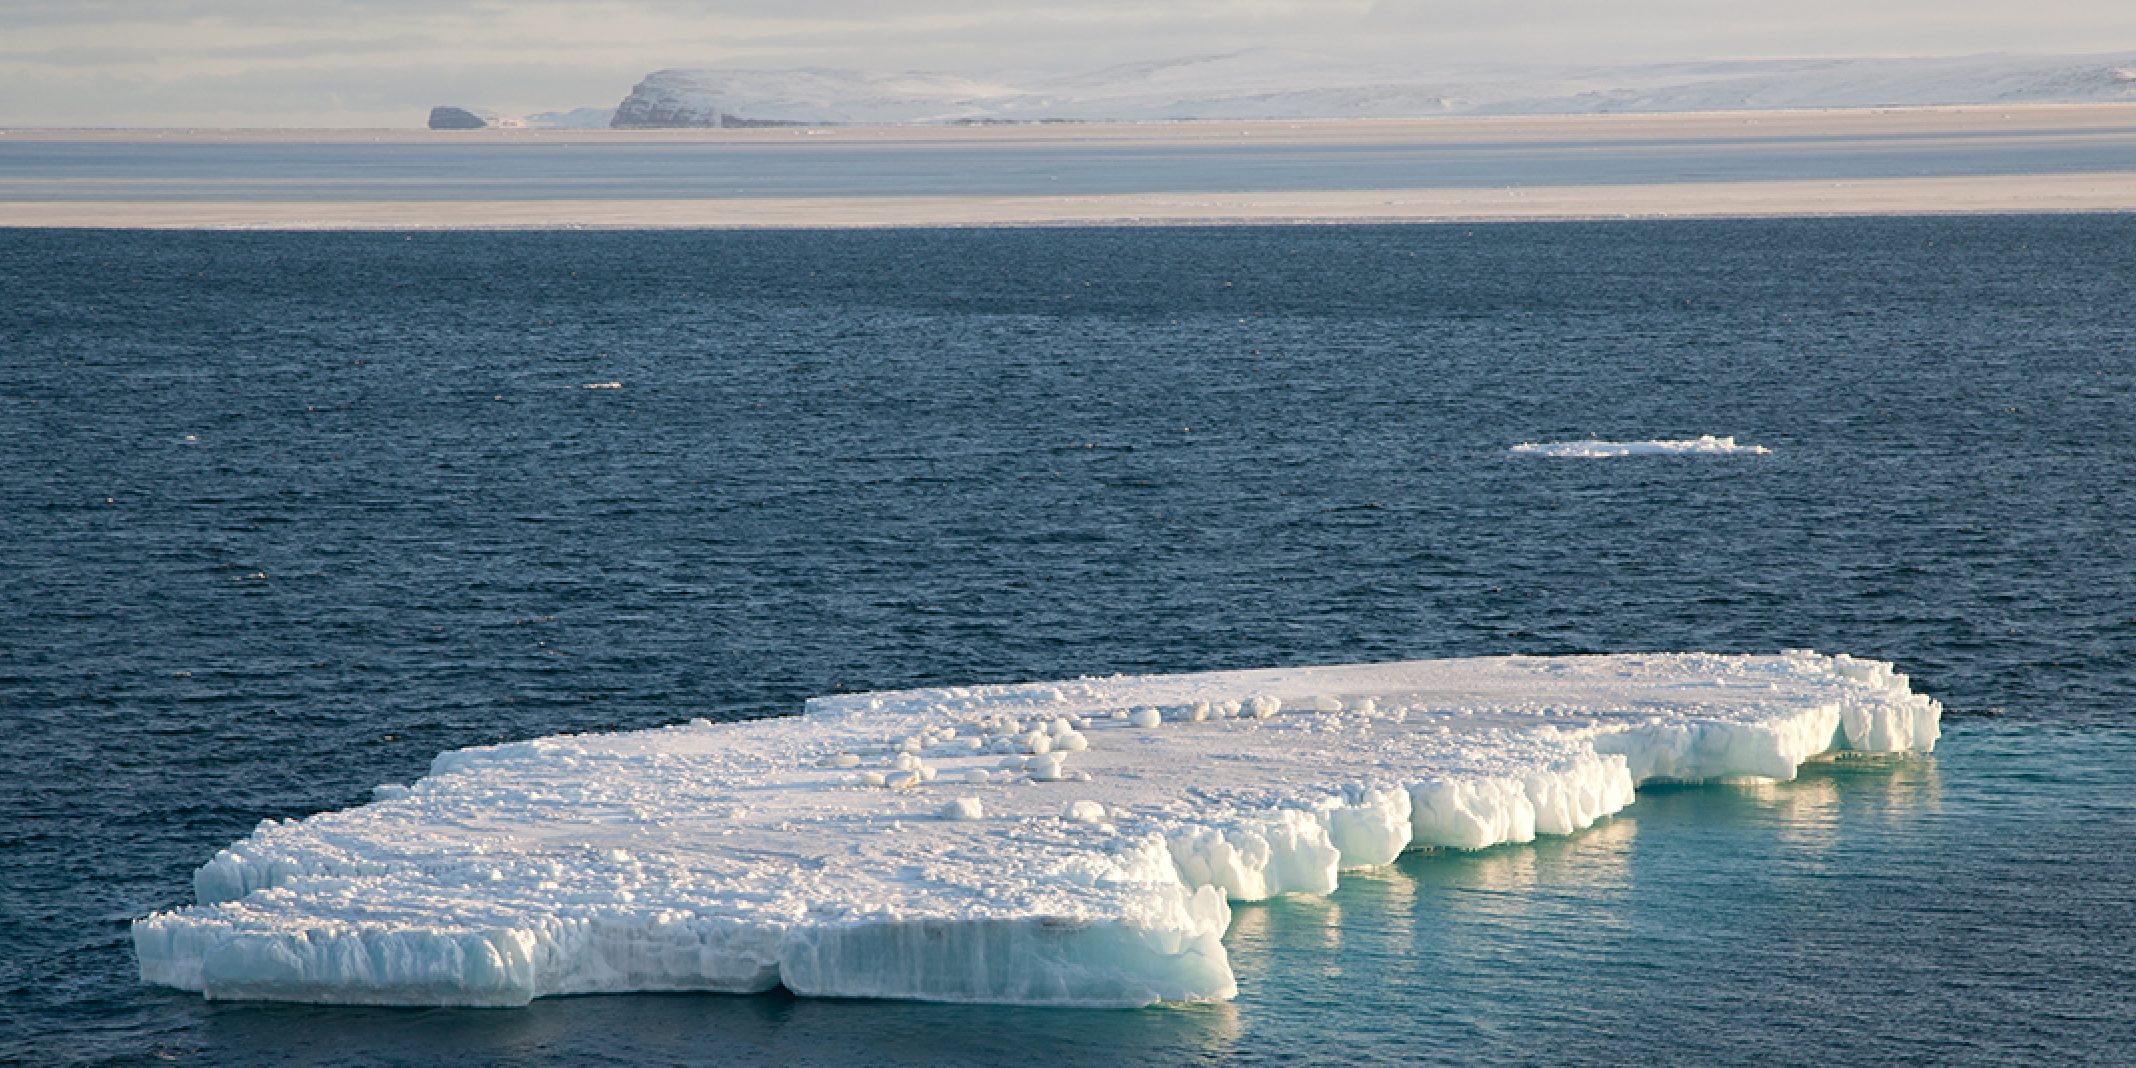
A NOAA-sponsored report shows that the warming trend transforming the Arctic persisted in 2017, resulting in the second warmest air temperatures, above average ocean temperatures, loss of sea ice, and a range of human, ocean and ecosystem effects.
Now in its 12th year, the Arctic Report Card, released today at the annual American Geophysical Union fall meeting in New Orleans, is a peer-reviewed report that brings together the work of 85 scientists from 12 nations.
While 2017 saw fewer records shattered than in 2016, the Arctic shows no sign of returning to the reliably frozen region it was decades ago. Arctic temperatures continue to increase at double the rate of the global temperature increase.
One chapter in the Arctic Report Card shows, using historical data that the current observed rate of sea ice decline and warming temperatures are higher than at any other time in the last 1,500 years, and likely longer than that.
The Arctic Report Card provides an annual update on how the region is faring environmentally, and compares these observations to the long-term record. This information can be used to inform decisions on adaptation by of local, tribal, state and federal leaders as they confront both the obstacles and the possibilities posed by a changing climate to economic growth, national security, public safety and natural resource conservation.
“The rapid and dramatic changes we continue to see in the Arctic present major challenges and opportunities,” said retired Navy Rear Adm. Timothy Gallaudet, Ph.D., acting NOAA administrator, who led the press conference to release the report card. “This year’s Arctic Report Card is a powerful argument for why we need long-term sustained Arctic observations to support the decisions that we will need to make to improve the economic well-being for Arctic communities, national security, environmental health and food security.”
Major findings in this year’s report include:
• Warmer air temperature. Average annual air temperature over land was the second highest after 2016 in the observational record, with a temperature 2.9 degrees Fahrenheit (1.6 Celsius) above the average for 1981 to 2010.
• Declining sea ice. This year’s maximum winter sea ice area, measured each March, was the lowest ever observed, while this year’s minimum area, measured each September, was eighth-lowest on record. Sea ice is also getting thinner each year, with year-old ice comprising 79 percent of coverage, and multi-year ice just 21 percent. In 1985, multi-year ice accounted for 45 percent of sea ice.
• Above average ocean temperature. Sea surface temperatures in August 2017 were 7.2 degrees Fahrenheit (4 Celsius) above the average in the Barents and Chukchi seas. Surface waters of the Chukchi Sea have warmed 1.26 degrees Fahrenheit (0.7 Celsius) per decade since 1982.
• Arctic ocean plankton blooms increasing. Springtime melting and retreating sea ice which allows sunlight to reach the upper layers of the ocean, continues to stimulate increased chlorophyll as measured by satellite, which indicates more marine plant growth across the Arctic. This increase has occurred since measurements began in 2003.
• Greener tundra. Overall vegetation, including plants getting bigger and leafier, and shrubs and trees taking over grassland or tundra, increased across the Arctic in 2015 and 2016, as measured by satellite. The greatest increases over the last three decades are occurring on the North Slope of Alaska, Canada’s tundra and Taimyr Peninsula of Siberia. The annual report on vegetation is based largely on data from sensors aboard NOAA weather satellites.
• Snow cover up in Asia, down in North America. For the 11th year in the past 12, snow cover in the North American Arctic was below average, with communities experiencing earlier snow melt. The Eurasian part of the Arctic saw above average snow cover extent in 2017, the first time that’s happened since 2005.
• Less melt on Greenland Ice Sheet. Melting began early on the Greenland Ice Sheet in 2017, but slowed during a cooler summer, resulting in below-average melting when compared to the previous nine years. Overall, the Greenland Ice Sheet, a major contributor to sea level rise, continued to lose mass this past year, as it has since 2002 when measurements began.
This year’s report card also includes special reports on how the warming trend is affecting valuable fisheries in the eastern Bering Sea; compromising roads, homes and infrastructure due to permafrost thaw; and threatening the high latitudes with increasingly frequent wildfires.


